Powerful timeseries metrics using Timescale and Laravel

I help develop a baby registry platform that allows expecting parents to create and share a wishlist of baby products they want. Friends and family can contribute to or purchase items directly from the list, helping parents prepare for the arrival of their baby. The platform supports multi-store listings, price tracking, and personalized recommendations.
To provide brands with actionable insights, I’m building a dedicated data platform focused on time series analytics. Brands will be able to track how key metrics—like monthly purchase trends, wishlist frequency, and competitive comparisons—evolve over time, helping them monitor their brand performance.
In this video and article I wanted to take a quick look at how we achieve these type of timeseries analytics using Postgres and TimeScaleDB.
Architecture
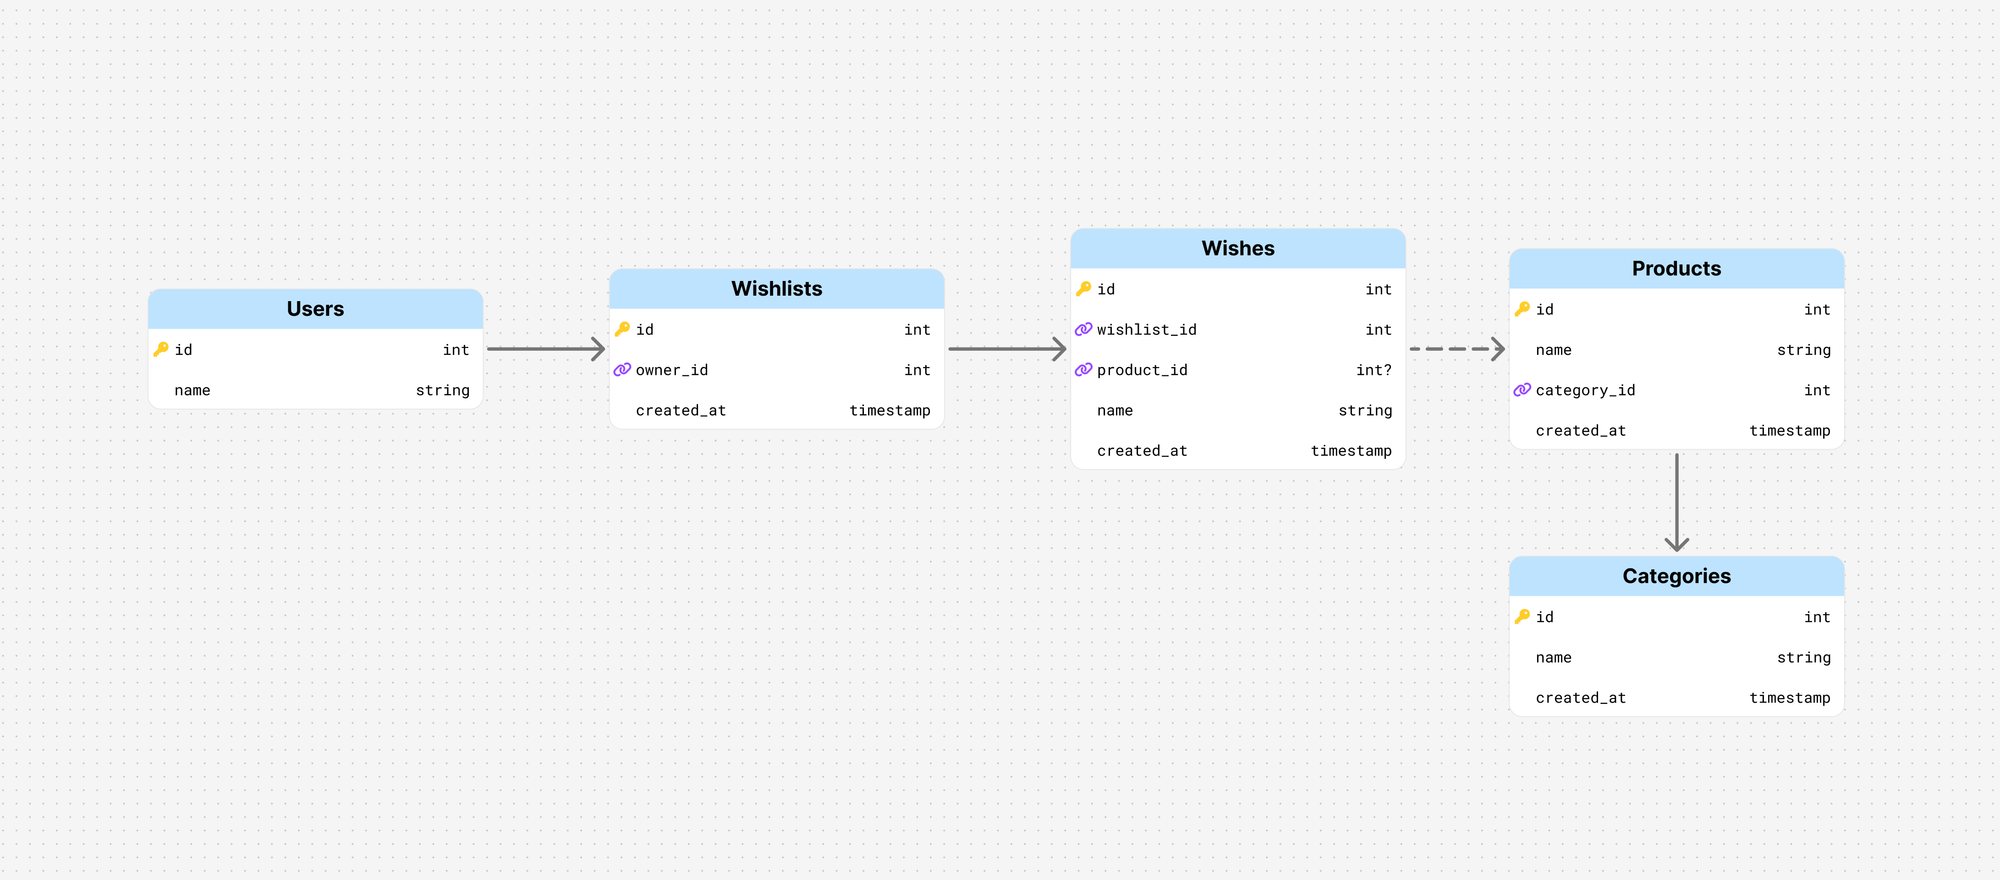
Our application is based on Laravel and our main database is powered by MySQL. On a high-level, our database looks a little something like this:

We have millions of rows in the wishes table, and even though our database is pretty well optimised, querying this data for displaying in a timeseries chart is challenging to say the least.
The fact that we need to join multiple tables or do subqueries is also not ideal, so we decided to create a separate database that has a flatter structure and is based on Postgres and TimescaleDB.
TimescaleDB
TimescaleDB is a plugin for Postgres that allows us to achieve a very high level of query performance with minimal effort. TimescaleDB has this concept called Hypertables, a type of table that automatically partitions your time-series data. And the cool thing is that you can interact with these Hypertables the same way you would with regular Postgres tables.
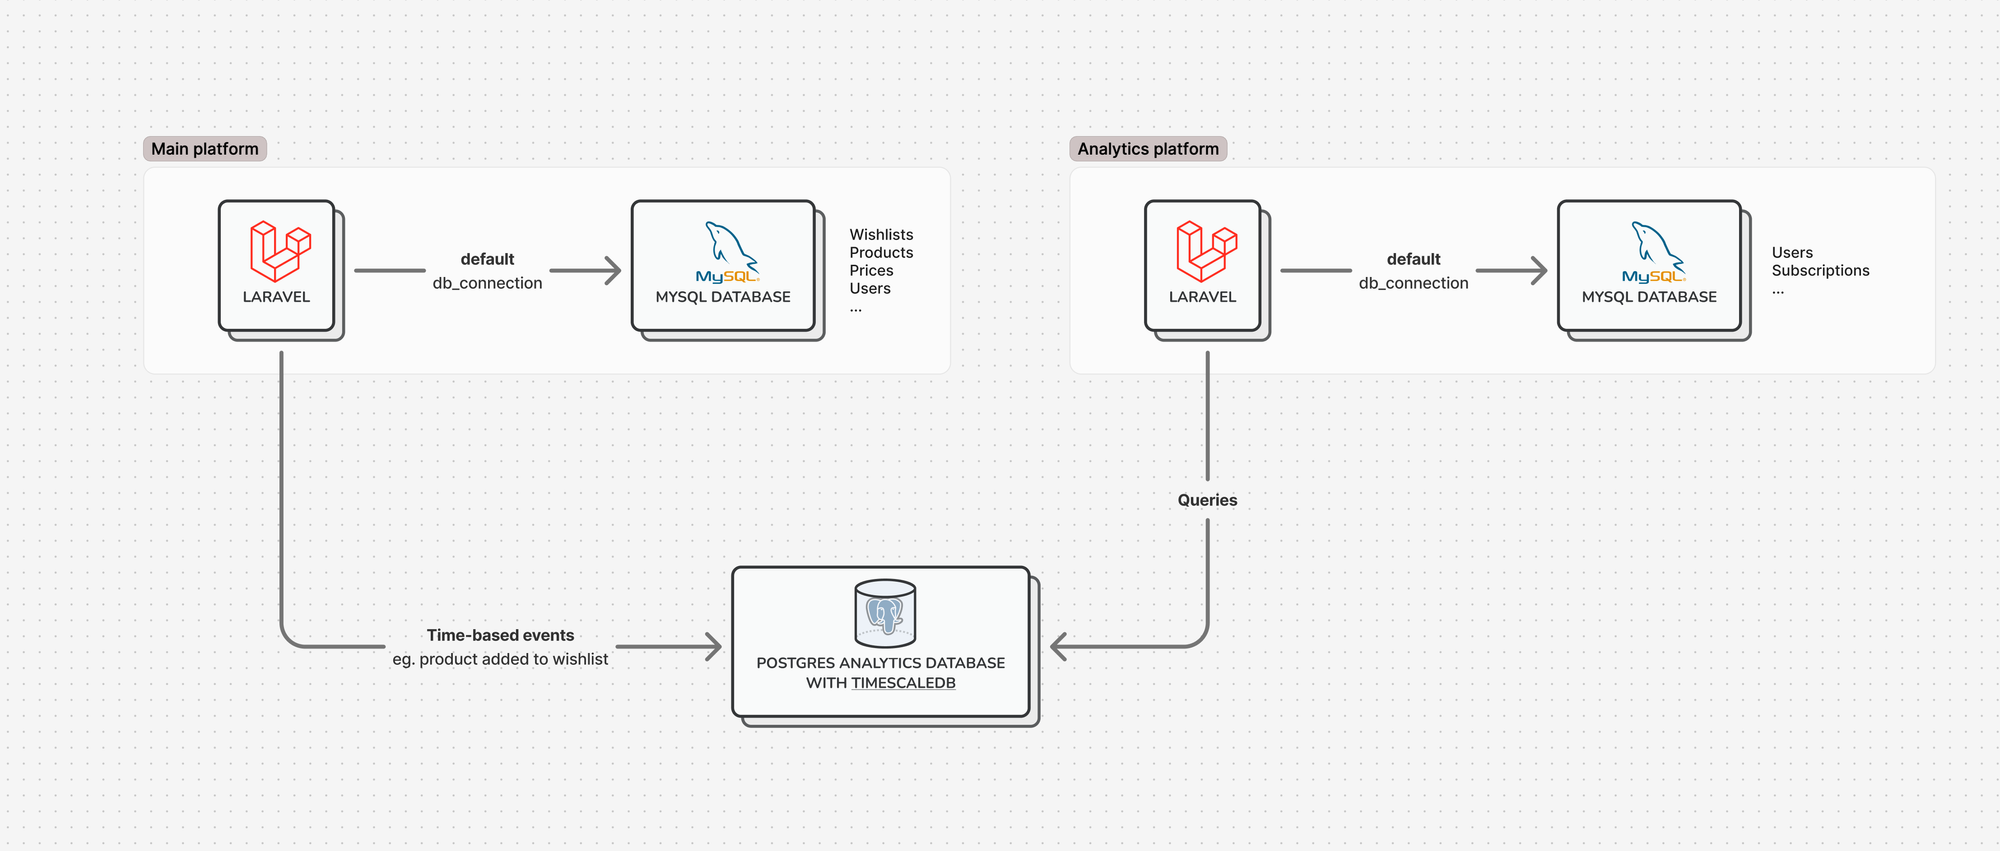
This is how TimescaleDB fits in our architecture:

We have our main application on the left, with the main MySQL database and we set up a secondary connection to a new Postgres database on which we installed TimescaleDB. (BTW, if you're using Valet locally you might run into errors, I described the fix here).
On the right, we have our second Laravel instance for the analytics platform, and this is also powered by its own MySQL database (for managing users, subscriptions, ...). This instance also has a secondary connection to our Postgres database for querying purposes.
The main platform fills up the postgres database nightly and the analytics platform is able to read from it.
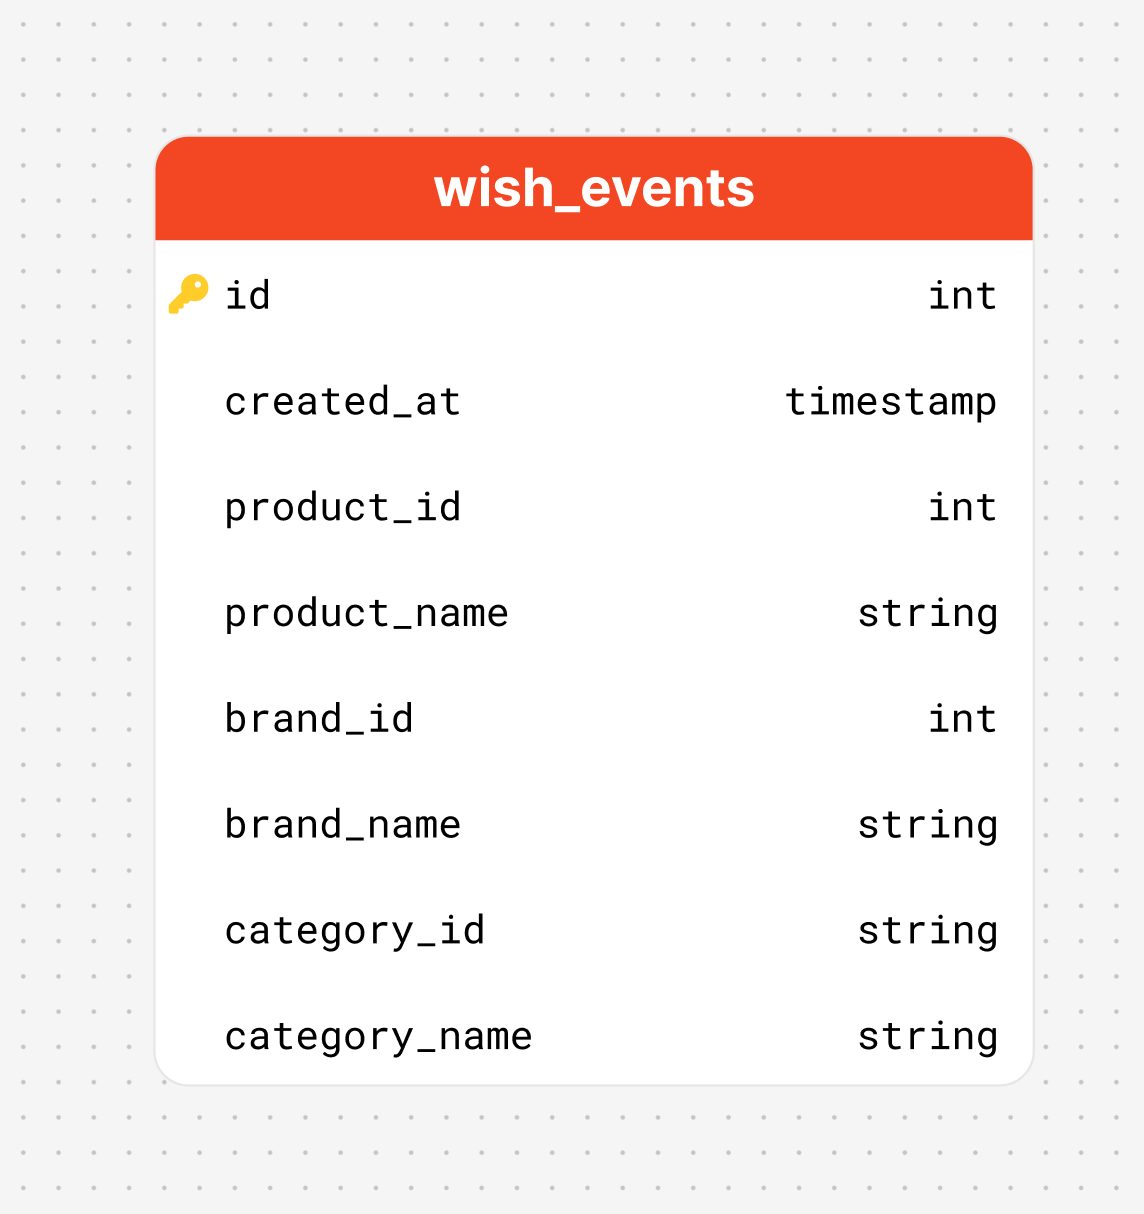
The postgres database is very simple and contains a single flattened table, so querying it is already much simpler.

Do note that the product_id, brand_id and category_id are not foreign keys, and simply allow us to query them from our main database - so we don’t need to copy things over.
Example
To make things easier to understand, I created an example repository. The example uses the new Laravel Vue starter kit and displays a Bar chart showcasing the amount of revenue of the selected period - and the amount of rows Timescale had to filter through.
Creating a hypertable is no rocket science:
Schema::create('orders', function (Blueprint $table) {
    $table->timestampTz('time');
    $table->decimal('price', 8, 2);
});
DB::statement("SELECT create_hypertable('orders', 'time')");
We first create our orders table that has a timestamptz called time, and we have a decimal for price - nothing special here.
The next line is where we instruct TimescaleDB to create a hypertable. We call create_hypertable, we pass in 'orders' and 'time' (table and timestamp) and this will instruct TimescaleDB to partition the table by date and time. And that’s basically it!
I included a dummy CSV in the storage directory which you can import using TablePlus.
Logic
The first thing I like to do when dealing with timeseries data, is split the queries up in their own files. This makes it very easy to do changes, and even test them out in Tableplus.
So, under resources/queries you can find my 2 queries - we have our main query ‘revenue-per-period’ and our count query ‘rows-per-period’.
Then I created a quick utility class that helps me execute and cache the queries as follows:
<?php

namespace App\Utils;

use Illuminate\Support\Facades\Cache;
use Illuminate\Support\Facades\DB;

class Query {
    static function execute($file, $params)
    {
        $key = 'query-' . $file . '-' . md5(serialize($params));
        return Cache::remember($key, 60, function() use ($file, $params) {
            $sql = file_get_contents(resource_path('queries/' . $file . '.sql'));
            return DB::select($sql, $params);
        });
    }
}
Query helper
The 'revenue-per-period' query is where the magic happens. The query is pretty simple:
SELECT time_bucket(:bucket, time) AS period,
       SUM(price) revenue
FROM orders
WHERE time >= :from AND time < :to
GROUP BY period
ORDER BY period
revenue-per-period.sql
The time_bucket function is TimescaleDB-specific, we have our :bucket, :from and :to dynamic parameters, so we can easily control this in our code.
$range = [2020, 2024];

$res = \App\Utils\Query::execute('revenue-per-period', [
    'bucket' => '1 month',
    'from' => Carbon::createFromDate($range[0])->startOfYear(),
    'to' => Carbon::createFromDate($range[1])->endOfYear(),
]);
Executing the query and passing dynamic parameters
Next up, we need to prepare the data to be displayed in a ShadCN barchart. The data required is something like:
const data = [{
  name: 'Jan',
  2020: 100,
  2021: 200,
  2022: 300,
  // ...
}]
To achieve this, we can do some collection magic:
$data = collect($res)
    ->map(function($item) {
        return [
            'month' => Carbon::parse($item->period)->format('M'),
            'year' => Carbon::parse($item->period)->format('Y'),
            'revenue' => $item->revenue
        ];
    })
    ->groupBy('month')
    ->mapWithKeys(function ($items, $month) {
        return [
            $month => collect($items)->mapWithKeys(function ($item) use ($month) {
                return [
                    'name' => $month,
                    $item['year'] => (float) $item['revenue']
                ];
            })
        ];
    })
    ->values();
Data mapping
Next up, we can count the total number of rows using our rows-per-period query:
$totalRows = \App\Utils\Query::execute('rows-per-period', [
    'from' => Carbon::createFromDate($range[0])->startOfYear(),
    'to' => Carbon::createFromDate($range[1])->endOfYear(),
]);
SELECT COUNT(time)
FROM orders
WHERE time >= :from AND time < :torows-per-period.sql
And finally we render our Inertia view:
return Inertia::render('Chart', [
    'data' => $data,
    'total_rows' => $totalRows[0]->count,
    // Map [2020, 2024] into ['2020', '2021', '2022', '2023', '2024']
    'categories' => collect(range($range[0], $range[1]))->map(fn($year) => (string) $year),
]);
<BarChart
:data="data"
index="name"
:colors="['blue', 'green', 'red', 'orange', 'pink']"
:categories="categories"
/>Rendering our chart
And that’s it! This simple example already shows off the powerful features of creating charts using TimescaleDB.
Further reading
Interested in the business side of things? My colleague Dries talks about how our data can be a competitive advantage, check it out:

No spam, no sharing to third party. Only you and me.

